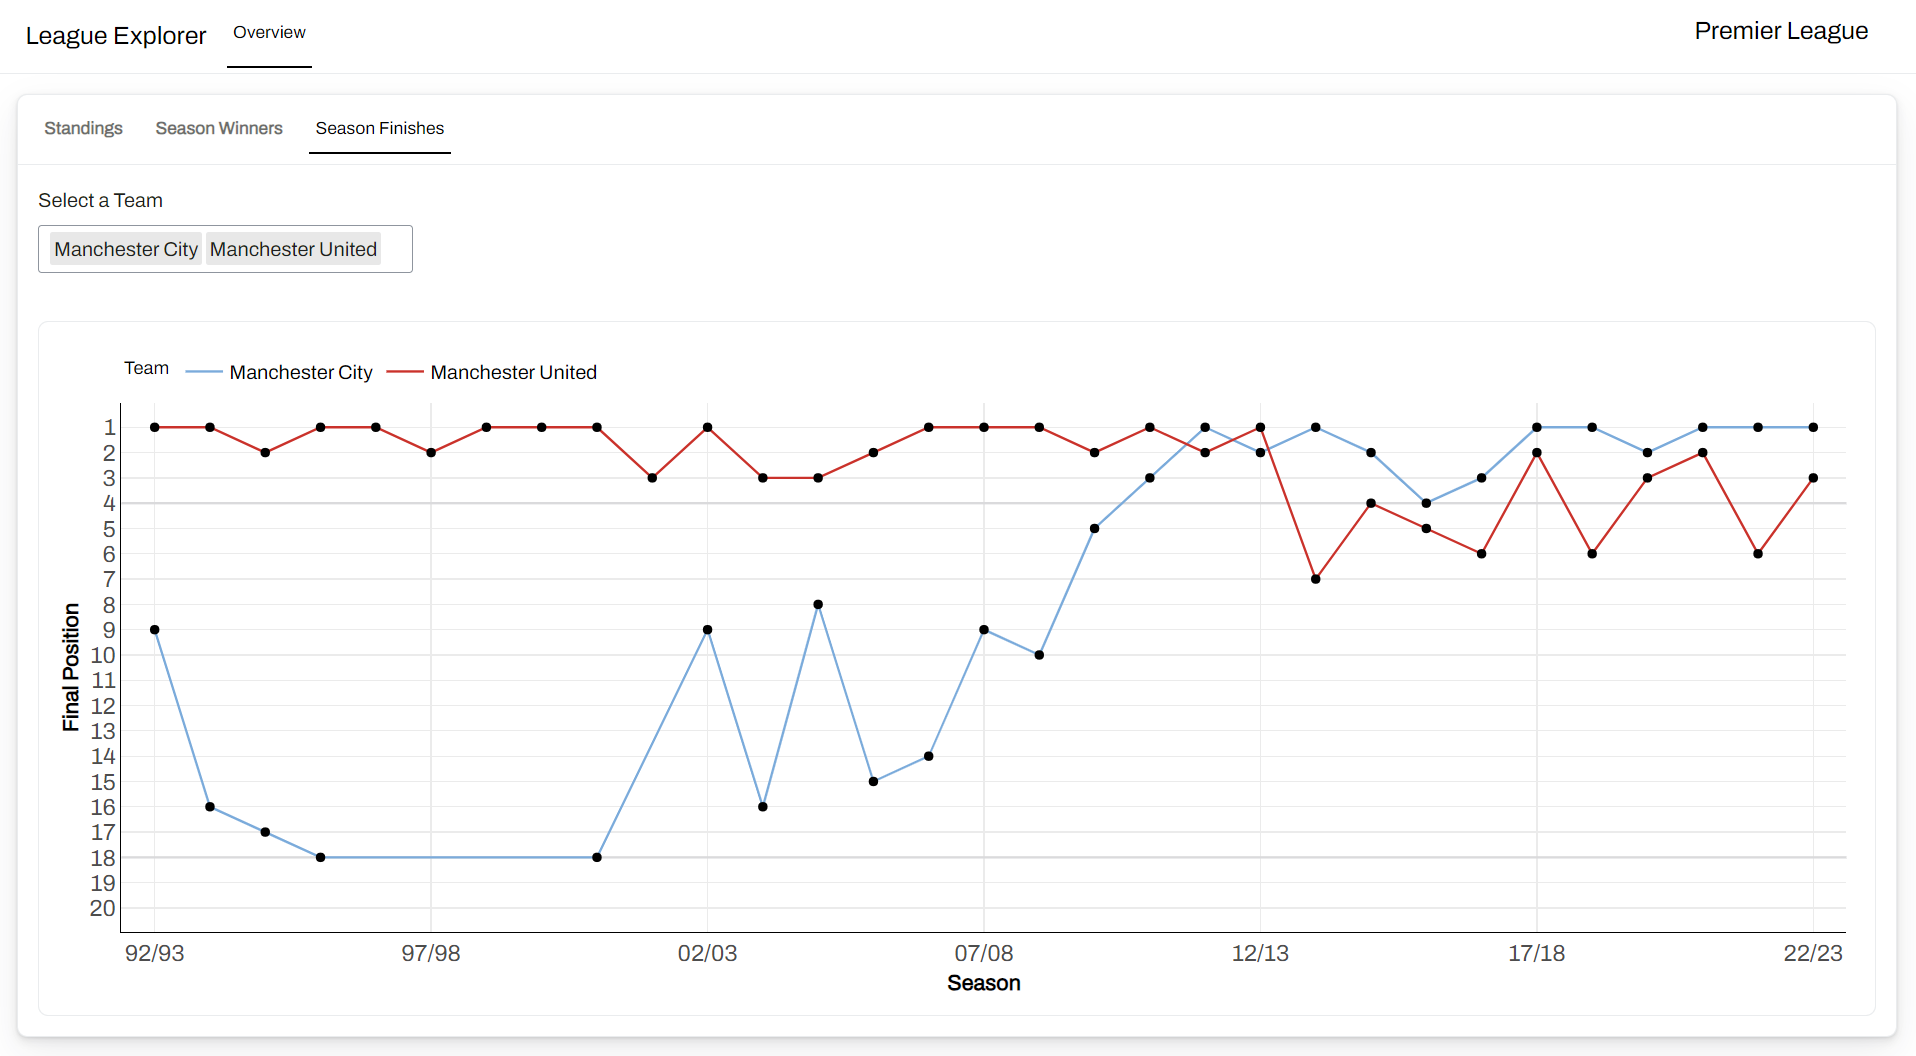
League Explorer
An interactive web application visualising football league data for insights and analysis.
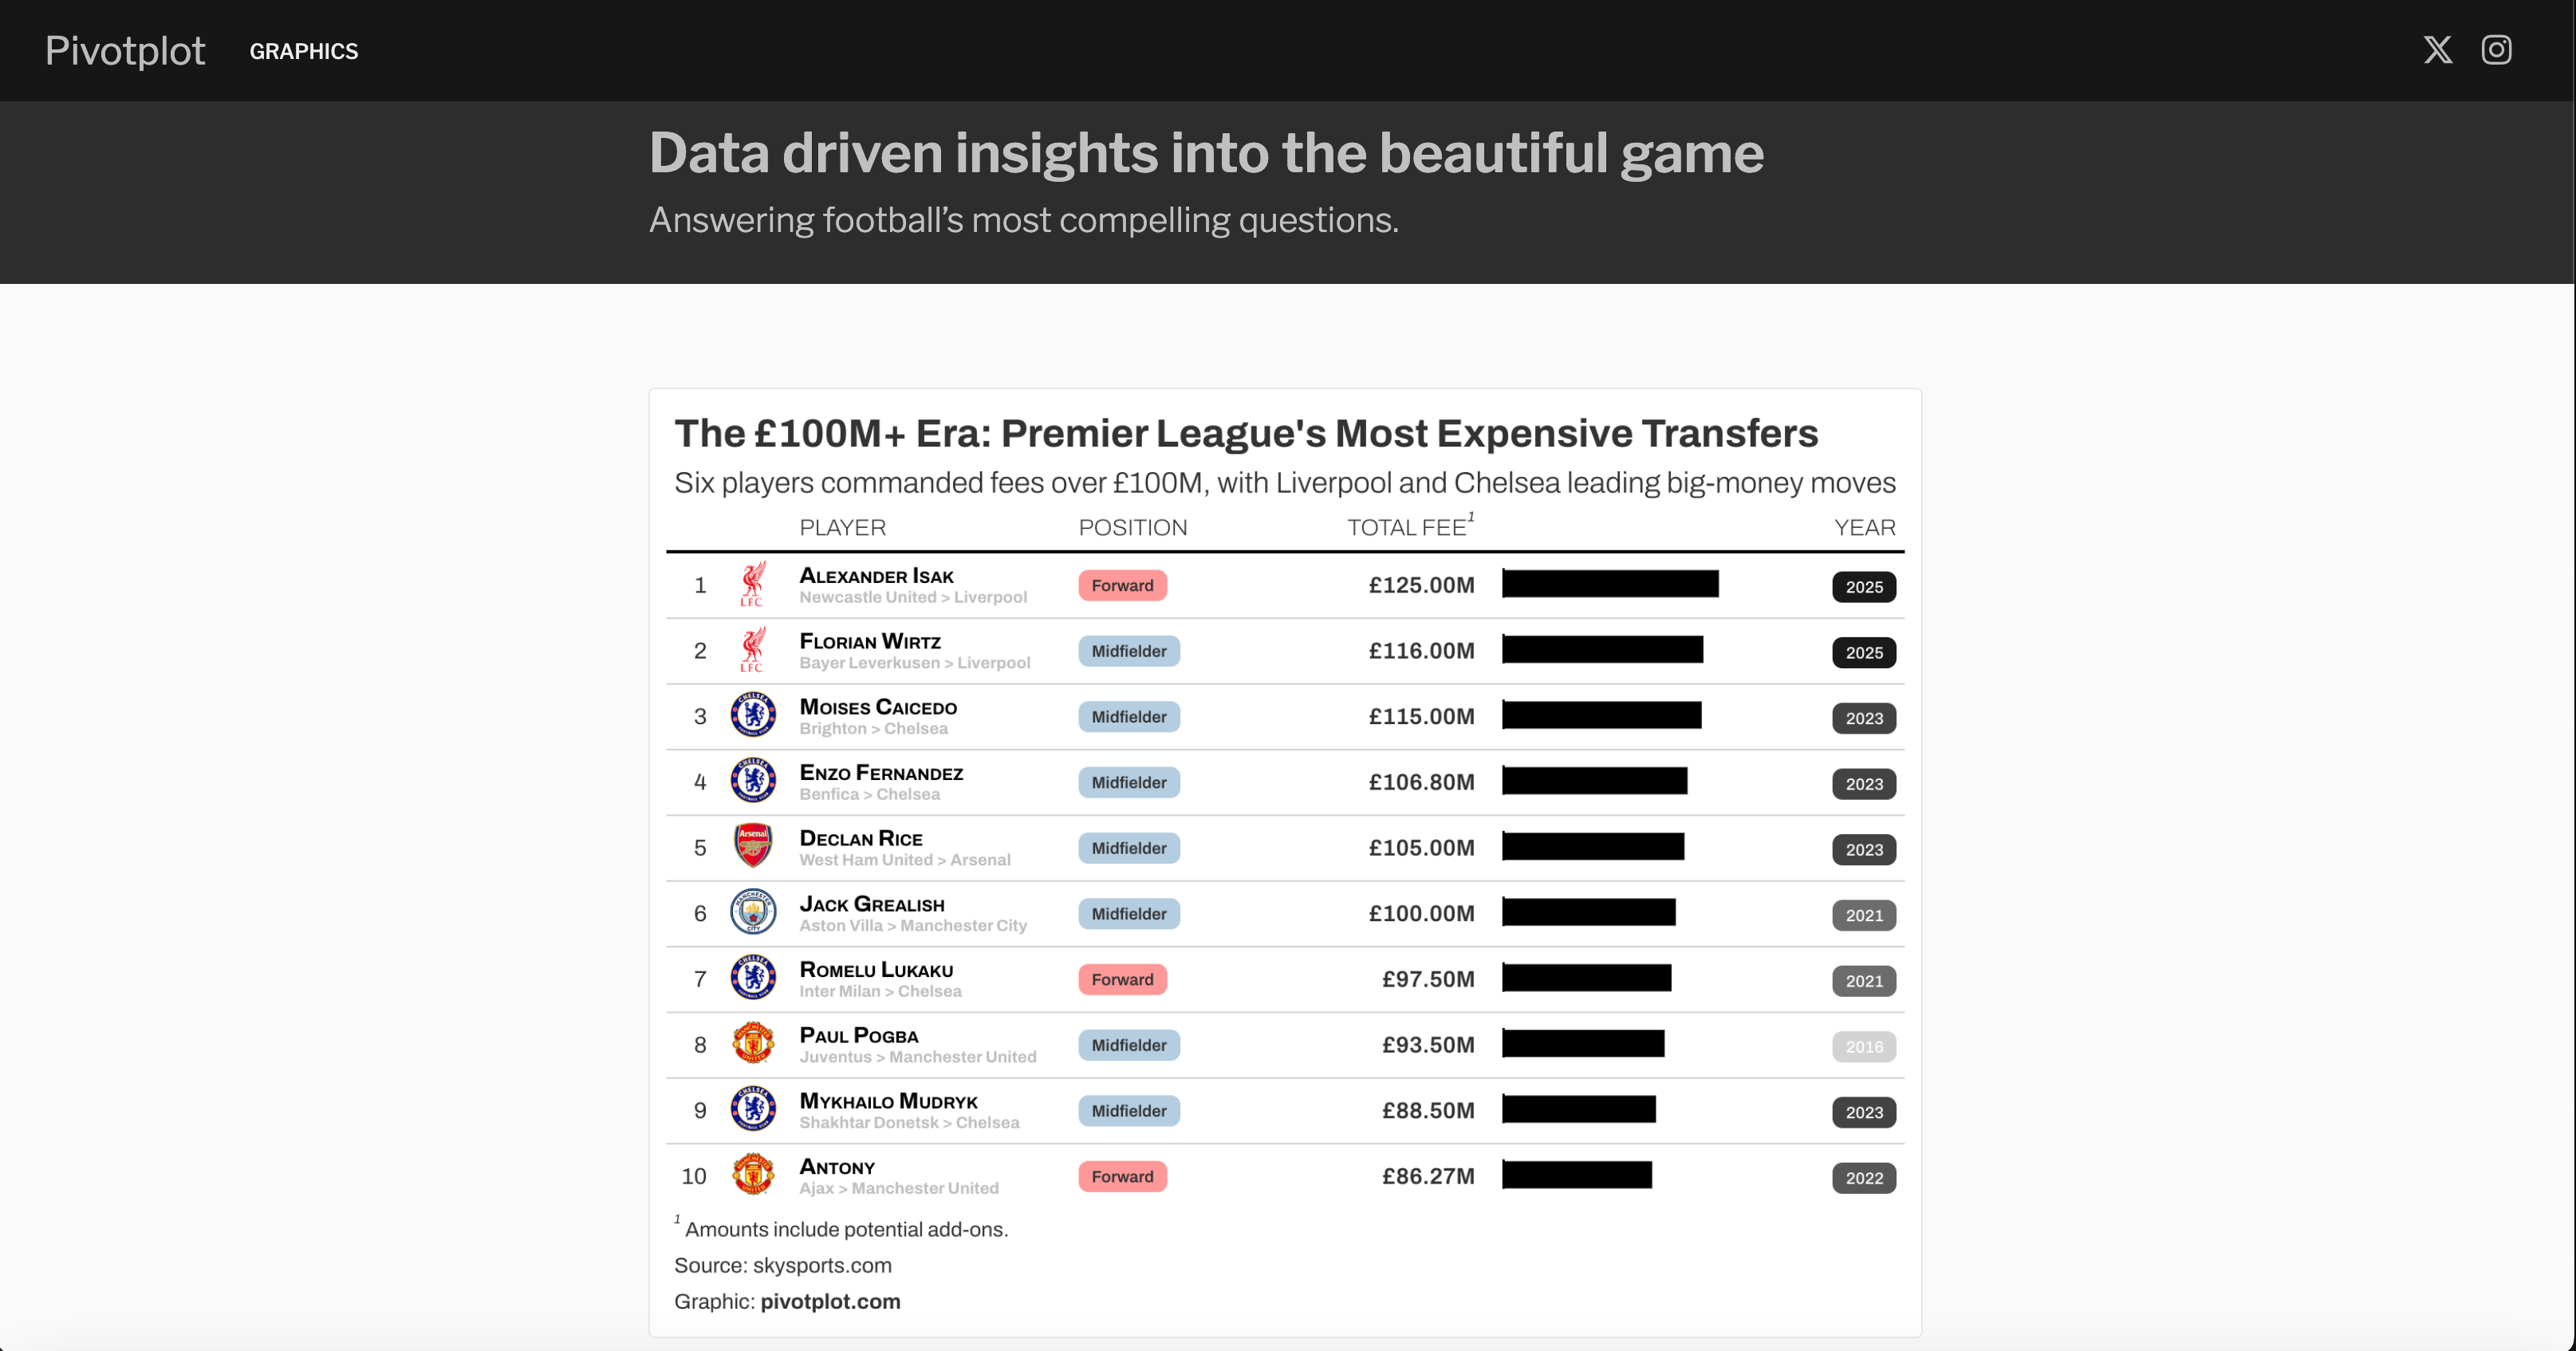
Pivotplot
Pivotplot.com is a football analytics website that uses data visualisation to provide insights and answer questions about football statistics and trends.
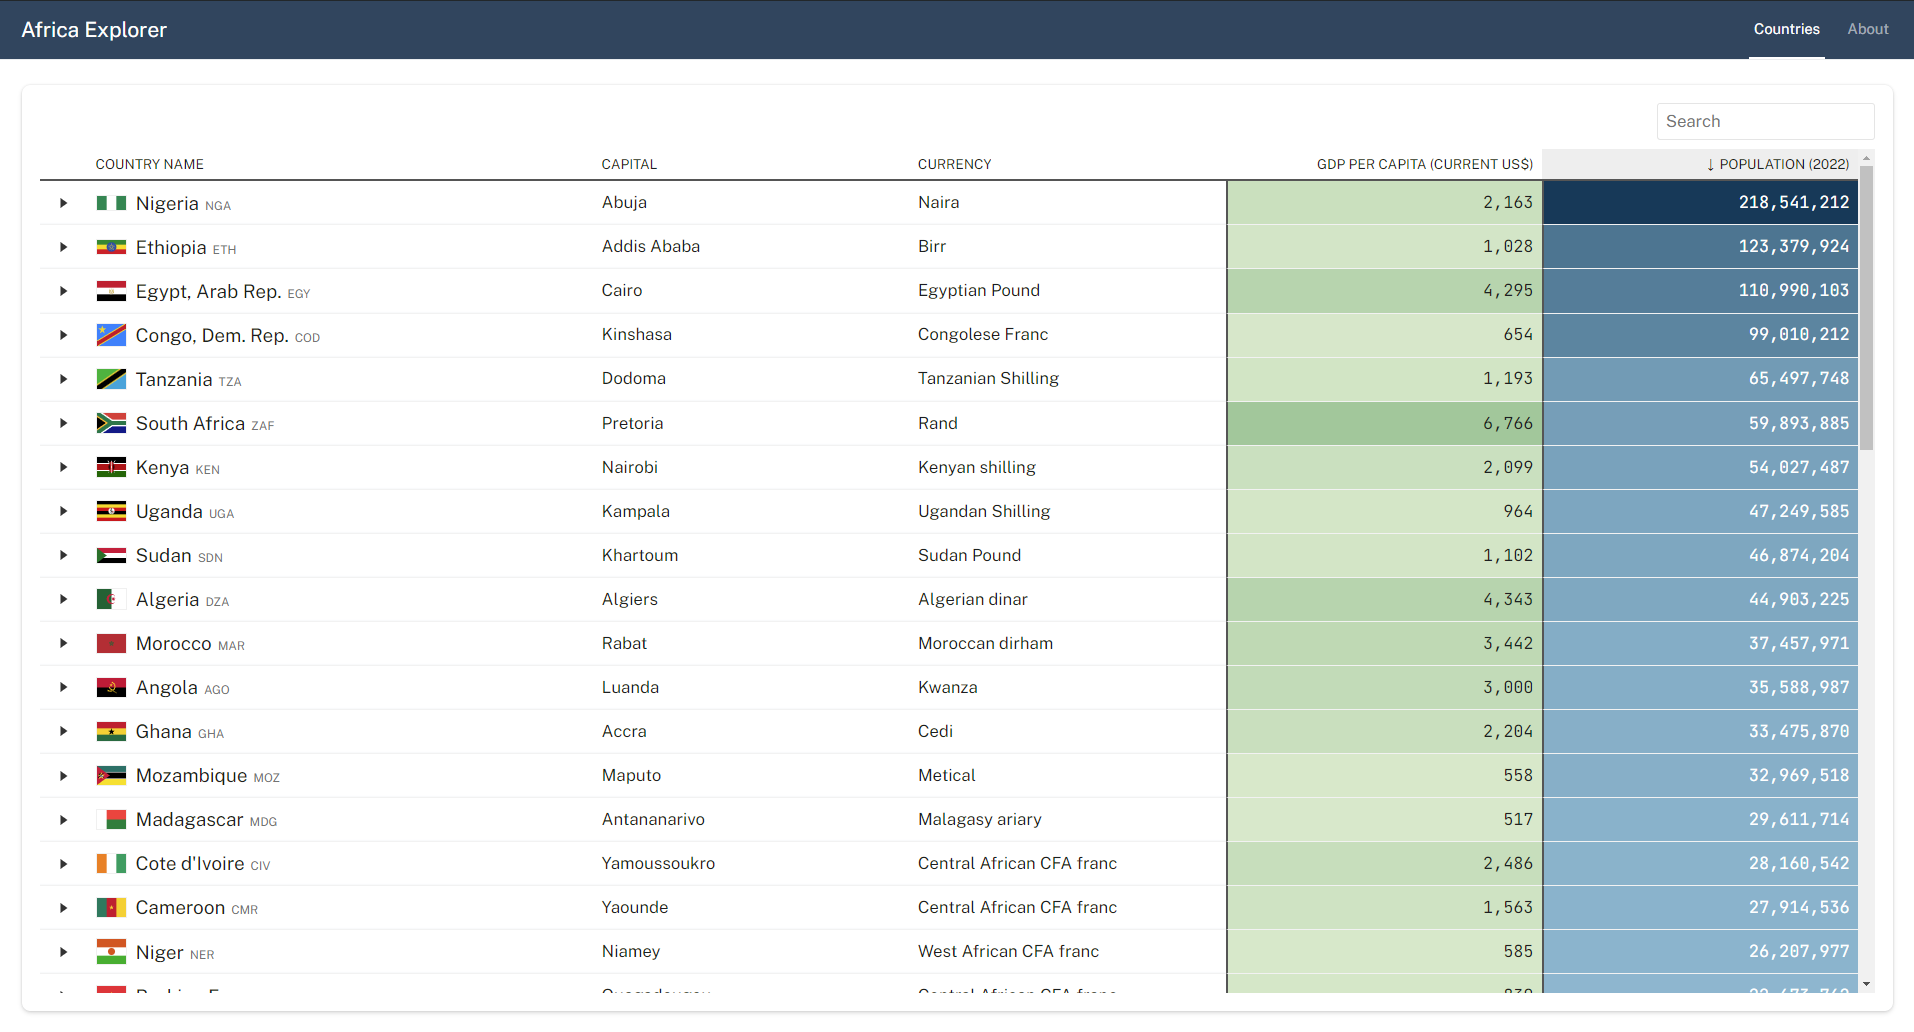
Africa Explorer
A table driven application for exploring Africa in numbers. Posit Table Contest: 2024 Edition.
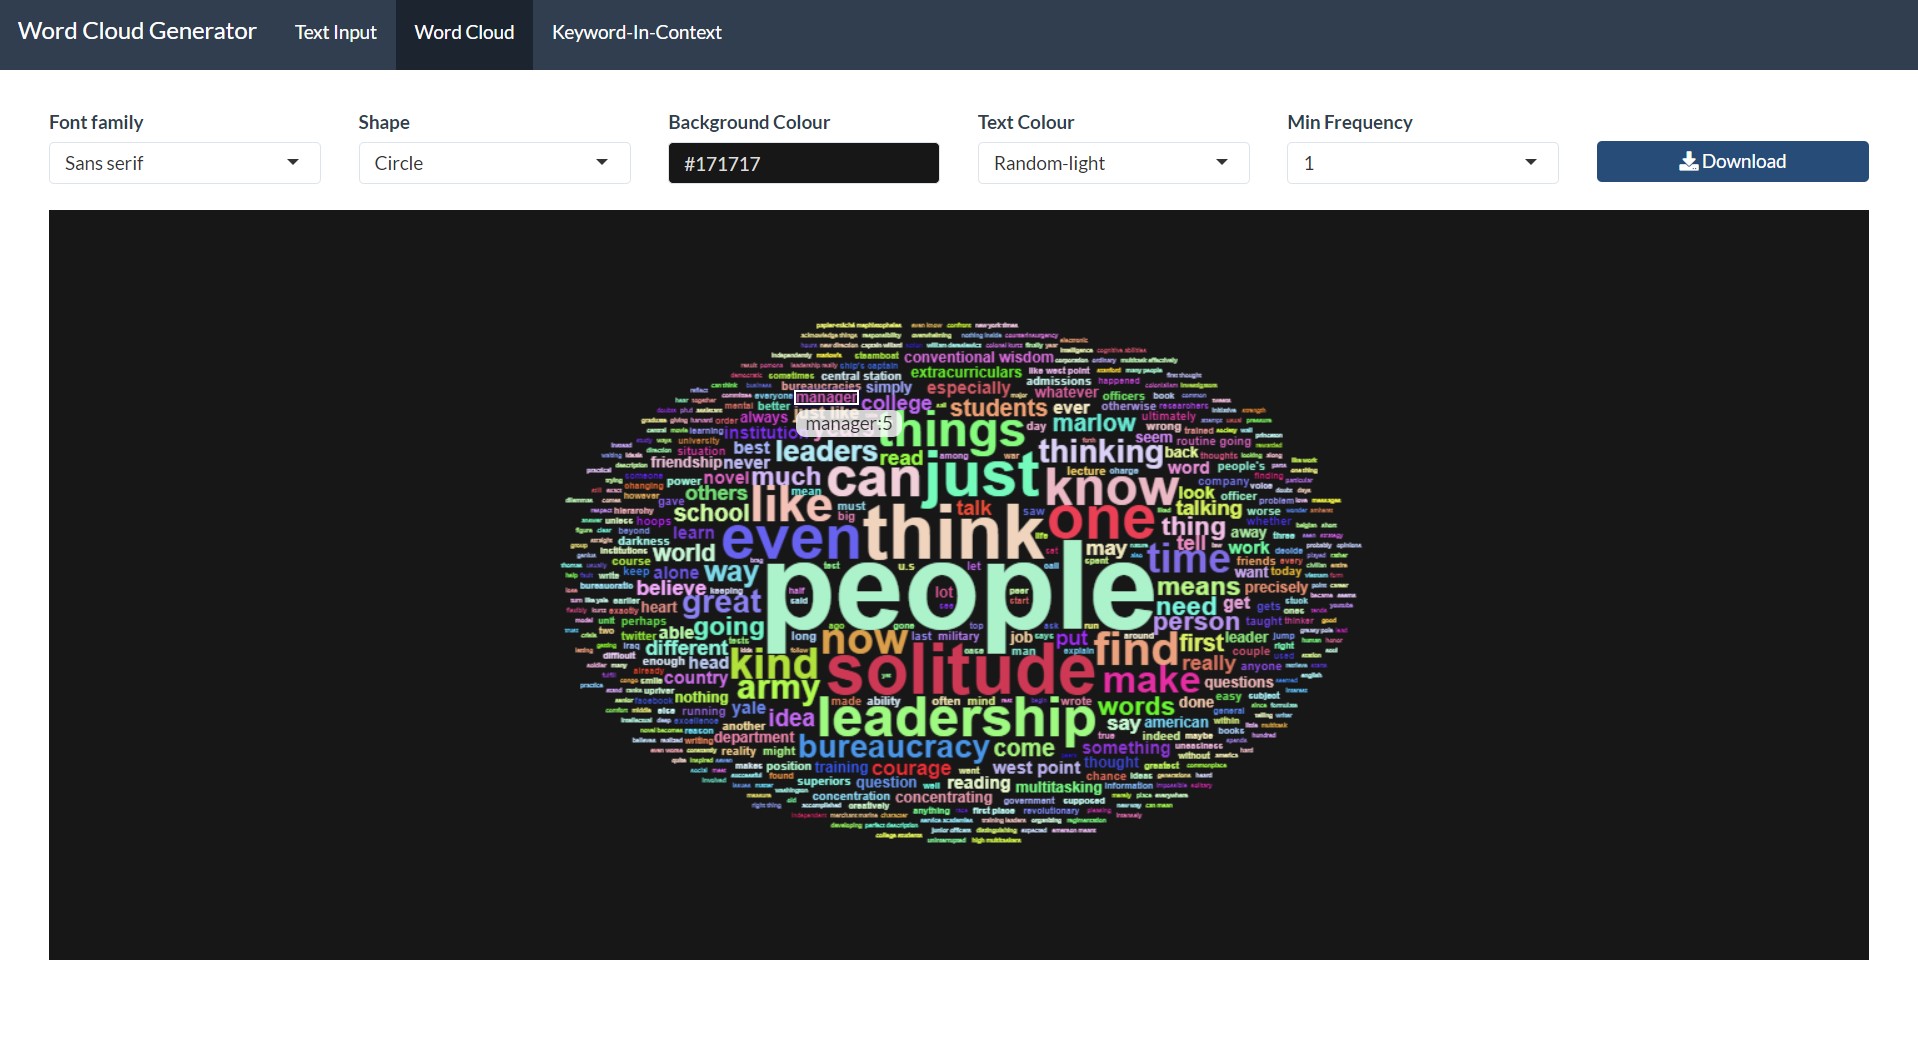
Wordcloud generator
A word cloud generating app for text visualisation. Supports multi-word keywords.